Pecan vs. Collard Greens
Nutrition comparison of Pecan and Collard Greens
Ever wonder how your favorite foods stack up against each other in terms of nutrition?
We compared the nutritional contents of
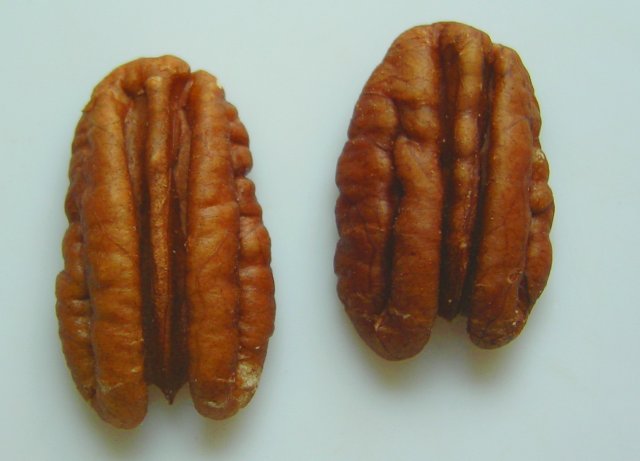
pecan
versus
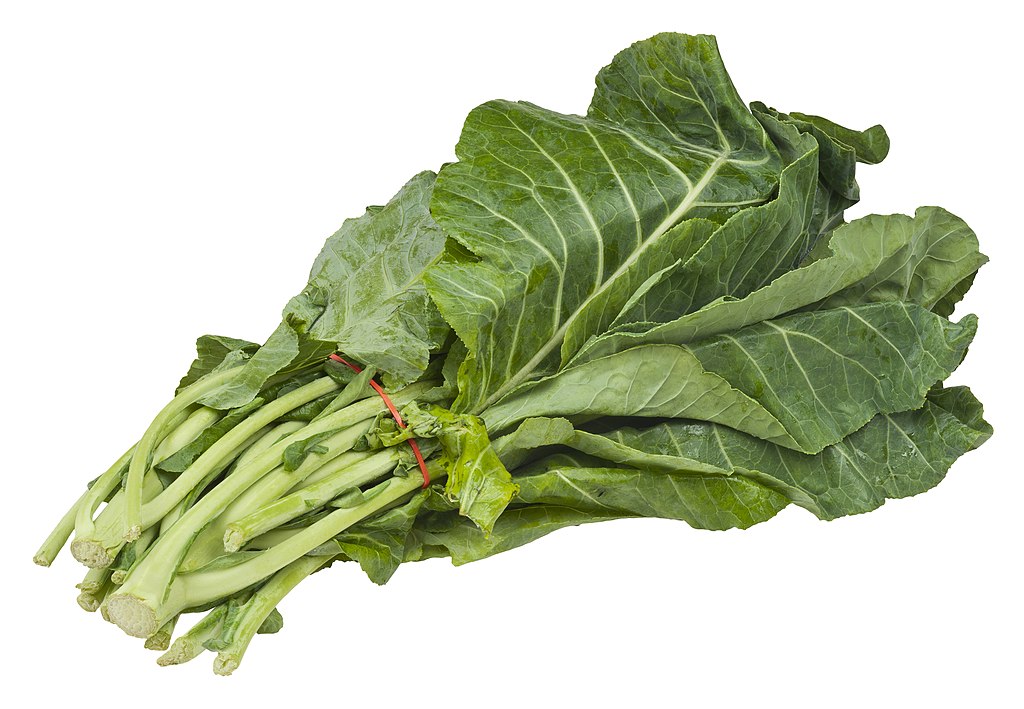
collard greens
(100g each)
below using 2020 USDA and NIH data[1].
For a quick recap of significant nutrients and differences in pecan and collard greens:
- Both pecan and collard greens are high in calcium, dietary fiber and potassium.
- Collard green has 61% less carbohydrates than pecan.
- Collard green is an excellent source of Vitamin A, Vitamin C and Vitamin K.
- Pecan has more thiamin and pantothenic acid, however, collard green contains more folate.
- Pecan is a great source of iron and protein.
USDA sources for nutritional information: Pecan (Nuts, pecans) and Collard Greens (Collards, raw) . Have a correction or suggestions? Shoot us an email.
Calories and Carbs
calories
Pecan is high in calories and collard green has 95% less calories than pecan - pecan has 691 calories per 100 grams and collard green has 32 calories.
For macronutrient ratios, pecan is much lighter in protein, much lighter in carbs and much heavier in fat compared to collard greens per calorie. Pecan has a macronutrient ratio of 5:8:88 and for collard greens, 31:56:13 for protein, carbohydrates and fat from calories.
Macro Ratios from Calories:
| Pecan | Collard Greens | |
|---|---|---|
| Protein | 5% | 31% |
| Carbohydrates | 8% | 56% |
| Fat | 88% | 13% |
| Alcohol | ~ | ~ |
carbohydrates
Collard green has 61% less carbohydrates than pecan - pecan has 13.9g of total carbs per 100 grams and collard green has 5.4g of carbohydrates.
The carbs in pecan are made of 68% dietary fiber, 28% sugar and 3% starch, whereas the carbs in collard greens comprise of 90% dietary fiber and 10% sugar.
dietary fiber
Both pecan and collard greens are high in dietary fiber. Pecan has 140% more dietary fiber than collard green - pecan has 9.6g of dietary fiber per 100 grams and collard green has 4g of dietary fiber.
sugar
Pecan and collard greens contain similar amounts of sugar - pecan has 4g of sugar per 100 grams and collard green has 0.46g of sugar.
Protein
protein
Pecan is a great source of protein and it has 204% more protein than collard green - pecan has 9.2g of protein per 100 grams and collard green has 3g of protein.
Fat
saturated fat
Pecan is high in saturated fat and collard green has 99% less saturated fat than pecan - pecan has 6.2g of saturated fat per 100 grams and collard green has 0.06g of saturated fat.
Vitamins
Vitamin C
Collard green is an excellent source of Vitamin C and it has 31 times more Vitamin C than pecan - pecan has 1.1mg of Vitamin C per 100 grams and collard green has 35.3mg of Vitamin C.
Vitamin A
Collard green is an excellent source of Vitamin A and it has 82 times more Vitamin A than pecan - pecan has 3ug of Vitamin A per 100 grams and collard green has 251ug of Vitamin A.
Vitamin E
Pecan and collard greens contain similar amounts of Vitamin E - pecan has 1.4mg of Vitamin E per 100 grams and collard green has 2.3mg of Vitamin E.
Vitamin K
Collard green is an excellent source of Vitamin K and it has 123 times more Vitamin K than pecan - pecan has 3.5ug of Vitamin K per 100 grams and collard green has 437.1ug of Vitamin K.
The B Vitamins
Pecan has more thiamin and pantothenic acid, however, collard green contains more folate. Both pecan and collard greens contain significant amounts of riboflavin, niacin and Vitamin B6.
| Pecan | Collard Greens | |
|---|---|---|
| Thiamin | 0.66 MG | 0.054 MG |
| Riboflavin | 0.13 MG | 0.13 MG |
| Niacin | 1.167 MG | 0.742 MG |
| Pantothenic acid | 0.863 MG | 0.267 MG |
| Vitamin B6 | 0.21 MG | 0.165 MG |
| Folate | 22 UG | 129 UG |
Minerals
calcium
Both pecan and collard greens are high in calcium. Collard green has 231% more calcium than pecan - pecan has 70mg of calcium per 100 grams and collard green has 232mg of calcium.
iron
Pecan is a great source of iron and it has 438% more iron than collard green - pecan has 2.5mg of iron per 100 grams and collard green has 0.47mg of iron.
potassium
Both pecan and collard greens are high in potassium. Pecan has 92% more potassium than collard green - pecan has 410mg of potassium per 100 grams and collard green has 213mg of potassium.
Antioxidants and Phytonutrients
carotenoids
Carotenoids are micronutrients commonly found in plants and some animal products. An example is beta-carotene, the notable carotenoid which is a popular source of Vitamin A.[4][5]
For specific types of carotenoids,
| Pecan | Collard Greens | |
|---|---|---|
| beta-carotene | 29 UG | 2991 UG |
| lutein + zeaxanthin | 17 UG | 4323 UG |
| alpha-carotene | ~ | 14 UG |
Omega-3 and Omega-6
omega 3s
For omega-3 fatty acids, pecan has more alpha linoleic acid (ALA) than collard green per 100 grams.
| Pecan | Collard Greens | |
|---|---|---|
| alpha linoleic acid | 0.986 G | 0.108 G |
| Total | 0.986 G | 0.108 G |
omega 6s
Comparing omega-6 fatty acids, pecan has more linoleic acid than collard green per 100 grams.
| Pecan | Collard Greens | |
|---|---|---|
| other omega 6 | ~ | 0.002 G |
| linoleic acid | 20.628 G | 0.082 G |
| Total | 20.628 G | 0.084 G |
Customize your serving size
The comparison below is by common portions, e.g. cups, packages. You can also see a more concrete comparison by weight at equal weight (by grams) comparison.
Note: The specific food items compared are: Pecan (Nuts, pecans) and Collard Greens (Collards, raw) .
Pecan g
()
|
Daily Values (%) |
Collard Greens g
()
|
|||||
|---|---|---|---|---|---|---|---|
| KCAL % |
|
5% | calories | 5% |
|
KCAL % | |
| G % |
|
5% | carbohydrates | 5% |
|
G % | |
| G % |
|
5% | dietary fiber | 5% |
|
G % | |
| G | 5% | sugar | 5% | G | |||
| G % |
|
5% | total fat | 5% |
|
G % | |
| G % |
|
5% | saturated fat | 5% |
|
G % | |
| G | 5% | monounsaturated fat | 5% | G | |||
| G | 5% | polyunsaturated fat | 5% | G | |||
| G | 5% | trans fat | 5% | G | |||
| MG | 5% | cholesterol | 5% | MG | |||
| MG % |
|
5% | sodium | 5% |
|
MG % | |
| 5% | Vitamins and Minerals | 5% | |||||
| UG % |
|
5% | Vitamin A | 5% |
|
UG % | |
| MG % |
|
5% | Vitamin C | 5% |
|
MG % | |
| IU % |
|
5% | Vitamin D | 5% |
|
IU % | |
| MG % |
|
5% | calcium | 5% |
|
MG % | |
| MG % |
|
5% | iron | 5% |
|
MG % | |
| MG % |
|
5% | magnesium | 5% |
|
MG % | |
| MG % |
|
5% | potassium | 5% |
|
MG % | |
| MG % |
|
5% | thiamin (Vit B1) | 5% |
|
MG % | |
| MG % |
|
5% | riboflavin (Vit B2) | 5% |
|
MG % | |
| MG % |
|
5% | niacin (Vit B3) | 5% |
|
MG % | |
| MG % |
|
5% | Vitamin B6 | 5% |
|
MG % | |
| MG % |
|
5% | pantothenic acid (Vit B5) | 5% |
|
MG % | |
| UG % |
|
5% | folate (Vit B9) | 5% |
|
UG % | |
| UG % |
|
5% | Vitamin B12 | 5% |
|
UG % | |
| MG % |
|
5% | Vitamin E | 5% |
|
MG % | |
| UG % |
|
5% | Vitamin K | 5% |
|
UG % | |
| G % |
|
5% | protein | 5% |
|
G % | |
| UG % |
|
5% | biotin (Vit B7) | 5% |
|
UG % | |
| MG % |
|
5% | choline | 5% |
|
MG % | |
| MG % |
|
5% | chlorine | 5% |
|
MG % | |
| UG % |
|
5% | chromium | 5% |
|
UG % | |
| MG % |
|
5% | copper | 5% |
|
MG % | |
| UG % |
|
5% | fluoride | 5% |
|
UG % | |
| UG % |
|
5% | iodine | 5% |
|
UG % | |
| MG % |
|
5% | manganese | 5% |
|
MG % | |
| UG % |
|
5% | molybdenum | 5% |
|
UG % | |
| MG % |
|
5% | phosphorus | 5% |
|
MG % | |
| UG % |
|
5% | selenium | 5% |
|
UG % | |
| MG % |
|
5% | zinc | 5% |
|
MG % | |
| G | 5% | Water | 5% | G | |||
| G | 5% | Starch | 5% | G | |||
| G | 5% | Alcohol | 5% | G | |||
FAQ
Does pecan or collard greens contain more calories in 100 grams?Pecan is high in calories and collard green has 100% less calories than pecan - pecan has 691 calories in 100g and collard green has 32 calories.
Is pecan or collard greens better for protein?
Pecan is a great source of protein and it has 200% more protein than collard green - pecan has 9.2g of protein per 100 grams and collard green has 3g of protein.
Does pecan or collard greens have more carbohydrates?
By weight, collard green has 60% fewer carbohydrates than pecan - pecan has 13.9g of carbs for 100g and collard green has 5.4g of carbohydrates. the carbs in pecan are made of 70% dietary fiber, 30% sugar and 0% starch, whereas the carbs in collard greens comprise of 90% dietary fiber and 10% sugar.
Does pecan or collard greens contain more calcium?
Both pecan and collard greens are high in calcium. Collard green has 230% more calcium than pecan - pecan has 70mg of calcium in 100 grams and collard green has 232mg of calcium.
Does pecan or collard greens contain more potassium?
Both pecan and collard greens are high in potassium. Pecan has 90% more potassium than collard green - pecan has 410mg of potassium in 100 grams and collard green has 213mg of potassium.