Brown Rice vs. Soy Flour
Nutrition comparison of Cooked Brown Rice and Soy Flour
Ever wonder how your favorite foods stack up against each other in terms of nutrition?
We compared the nutritional contents of
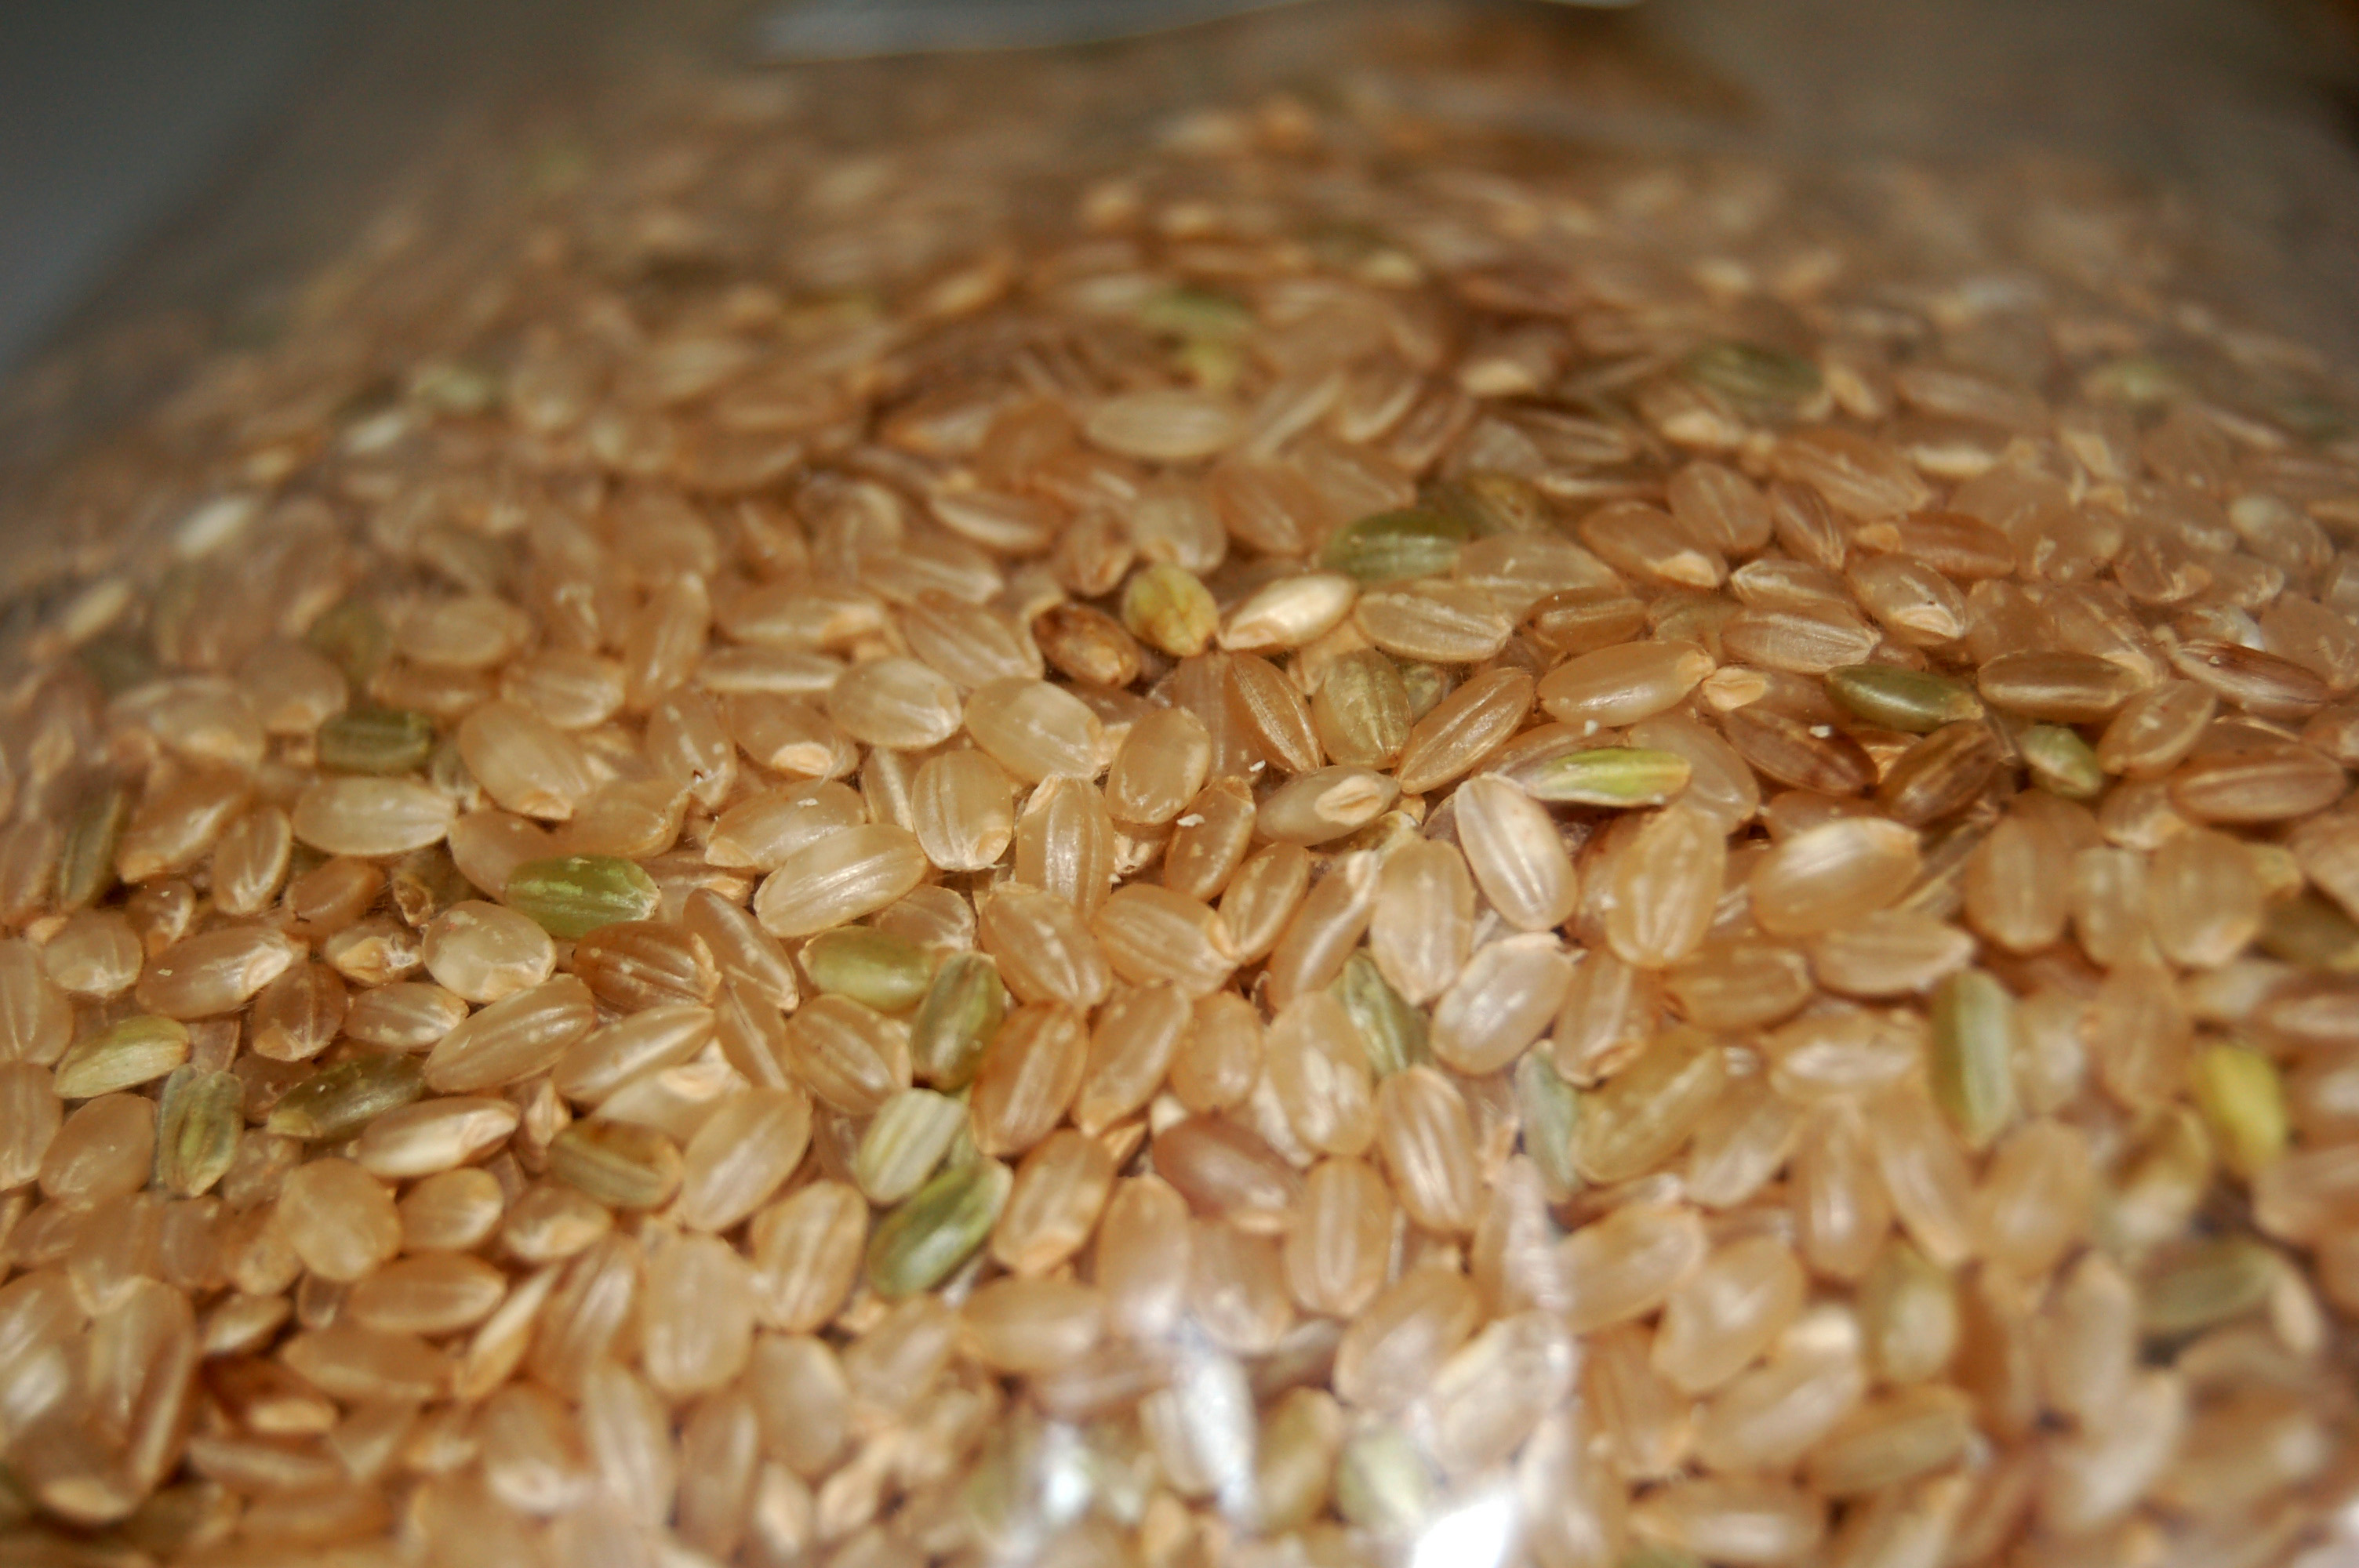
cooked
brown rice
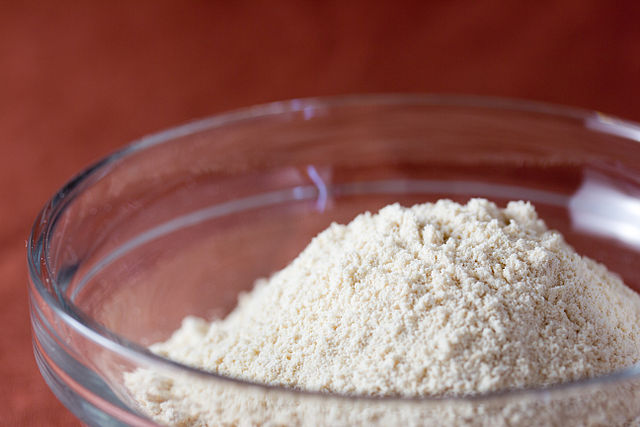
versus
soy flour
(100g each)
below using 2020 USDA and NIH data[1].
For a quick recap of significant nutrients and differences in brown rice and soy flour:
- Both brown rice and soy flour are high in calories.
- Brown rice has 3.9 times less saturated fat than soy flour.
- Brown rice has 37.8 times less sugar than soy flour.
- Soy flour has more thiamin, riboflavin, pantothenic acid, Vitamin B6 and folate.
- Soy flour is an excellent source of calcium, dietary fiber, iron, potassium and protein.
USDA sources for nutritional information: Brown Rice (Rice, brown, long-grain, cooked (Includes foods for USDA's Food Distribution Program)) and Soy Flour (Soy flour, low-fat) . Have a correction or suggestions? Shoot us an email.
Calories and Carbs
calories
Both brown rice and soy flour are high in calories. Soy flour has 202% more calories than brown rice - brown rice has 123 calories per 100 grams and soy flour has 372 calories.
For macronutrient ratios, brown rice is much lighter in protein, much heavier in carbs and lighter in fat compared to soy flour per calorie. Brown rice has a macronutrient ratio of 9:84:7 and for soy flour, 50:31:20 for protein, carbohydrates and fat from calories.
Macro Ratios from Calories:
| Brown Rice | Soy Flour | |
|---|---|---|
| Protein | 9% | 50% |
| Carbohydrates | 84% | 31% |
| Fat | 7% | 20% |
| Alcohol | ~ | ~ |
carbohydrates
Brown rice and soy flour contain similar amounts of carbs - brown rice has 25.6g of total carbs per 100 grams and soy flour has 30.6g of carbohydrates.
dietary fiber
Soy flour is an excellent source of dietary fiber and it has 900% more dietary fiber than brown rice - brown rice has 1.6g of dietary fiber per 100 grams and soy flour has 16g of dietary fiber.
sugar
Brown rice has 37.8 times less sugar than soy flour - brown rice has 0.24g of sugar per 100 grams and soy flour has 9.3g of sugar.
Protein
protein
Soy flour is an excellent source of protein and it has 17 times more protein than brown rice - brown rice has 2.7g of protein per 100 grams and soy flour has 49.8g of protein.
Fat
saturated fat
Brown rice has 3.9 times less saturated fat than soy flour - brown rice has 0.26g of saturated fat per 100 grams and soy flour has 1.3g of saturated fat.
Vitamins
Vitamin A
Soy flour and brown rice contain similar amounts of Vitamin A - soy flour has 2ug of Vitamin A per 100 grams and brown rice does not contain significant amounts.
Vitamin E
Brown rice and soy flour contain similar amounts of Vitamin E - brown rice has 0.17mg of Vitamin E per 100 grams and soy flour has 0.55mg of Vitamin E.
Vitamin K
Brown rice and soy flour contain similar amounts of Vitamin K - brown rice has 0.2ug of Vitamin K per 100 grams and soy flour has 3.9ug of Vitamin K.
The B Vitamins
Soy flour has more thiamin, riboflavin, pantothenic acid, Vitamin B6 and folate. Both brown rice and soy flour contain significant amounts of niacin.
| Brown Rice | Soy Flour | |
|---|---|---|
| Thiamin | 0.178 MG | 1.088 MG |
| Riboflavin | 0.069 MG | 0.28 MG |
| Niacin | 2.561 MG | 2.95 MG |
| Pantothenic acid | 0.38 MG | 1.55 MG |
| Vitamin B6 | 0.123 MG | 1.05 MG |
| Folate | 9 UG | 289 UG |
Minerals
calcium
Soy flour is an excellent source of calcium and it has 94 times more calcium than brown rice - brown rice has 3mg of calcium per 100 grams and soy flour has 285mg of calcium.
iron
Soy flour is an excellent source of iron and it has 13 times more iron than brown rice - brown rice has 0.56mg of iron per 100 grams and soy flour has 8.2mg of iron.
potassium
Soy flour is an excellent source of potassium and it has 23 times more potassium than brown rice - brown rice has 86mg of potassium per 100 grams and soy flour has 2090mg of potassium.
Omega-3 and Omega-6
omega 3s
For omega-3 fatty acids, soy flour has more alpha linoleic acid (ALA) than brown rice per 100 grams.
| Brown Rice | Soy Flour | |
|---|---|---|
| alpha linoleic acid | 0.011 G | 0.555 G |
| Total | 0.011 G | 0.555 G |
omega 6s
Comparing omega-6 fatty acids, soy flour has more linoleic acid than brown rice per 100 grams.
| Brown Rice | Soy Flour | |
|---|---|---|
| other omega 6 | 0.004 G | 0.025 G |
| linoleic acid | 0.355 G | 3.66 G |
| Total | 0.359 G | 3.685 G |
Customize your serving size
The comparison below is by weight, but sometimes 100g isn't that intuitive of a measurement for food. View a custom portion comparison (e.g. cups, oz, package).
You can try adding or subtracting the amount of either Brown Rice or Soy Flour .
Note: The specific food items compared are: Brown Rice (Rice, brown, long-grain, cooked (Includes foods for USDA's Food Distribution Program)) and Soy Flour (Soy flour, low-fat) .
Cooked Brown Rice 100g
(
100 g
)
|
Daily Values (%) |
Soy Flour 100g
(
100 g
)
|
|||||
|---|---|---|---|---|---|---|---|
| 123KCAL 6% |
|
5% | calories | 202% |
|
372KCAL 19% | |
| 26G 10% |
|
5% | carbohydrates | 19% |
|
31G 12% | |
| 1.6G 6% |
|
5% | dietary fiber | 900% |
|
16G 64% | |
| 0.24G | 5% | sugar | >999% | 9.3G | |||
| 0.97G 2% |
|
5% | total fat | 817% |
|
8.9G 14% | |
| 0.26G 1% |
|
5% | saturated fat | 400% |
|
1.3G 7% | |
| 0.37G | 5% | monounsaturated fat | 305% | 1.5G | |||
| 0.37G | 5% | polyunsaturated fat | >999% | 4.2G | |||
| 4MG 0.3% |
|
5% | sodium | 125% |
|
9MG 1% | |
| 5% | Vitamins and Minerals | 5% | |||||
|
|
5% | Vitamin A | >999% |
|
2UG 0.3% | ||
| 3MG 0.3% |
|
5% | calcium | >999% |
|
285MG 29% | |
| 0.56MG 3% |
|
5% | iron | >999% |
|
8.2MG 46% | |
| 39MG 13% |
|
5% | magnesium | 631% |
|
285MG 92% | |
| 86MG 4% |
|
5% | potassium | >999% |
|
2090MG 91% | |
| 0.18MG 16% |
|
5% | thiamin (Vit B1) | 511% |
|
1.1MG 99% | |
| 0.07MG 6% |
|
5% | riboflavin (Vit B2) | 300% |
|
0.28MG 26% | |
| 2.6MG 18% |
|
5% | niacin (Vit B3) | 15% |
|
3MG 21% | |
| 0.12MG 10% |
|
5% | Vitamin B6 | 816% |
|
1.1MG 81% | |
| 0.38MG 8% |
|
5% | pantothenic acid (Vit B5) | 321% |
|
1.6MG 31% | |
| 9UG 2% |
|
5% | folate (Vit B9) | >999% |
|
289UG 72% | |
| 0.17MG 1% |
|
5% | Vitamin E | 223% |
|
0.55MG 4% | |
| 0.2UG 0.2% |
|
5% | Vitamin K | >999% |
|
3.9UG 4% | |
| 2.7G 6% |
|
5% | protein | >999% |
|
50G 100% | |
| 9.2MG 2% |
|
5% | choline | >999% |
|
192MG 45% | |
| 0.11MG 9% |
|
5% | copper | >999% |
|
1.6MG 133% | |
| 0.97MG 54% |
|
5% | manganese | 230% |
|
3.2MG 175% | |
| 103MG 15% |
|
5% | phosphorus | 555% |
|
675MG 96% | |
| 5.8UG 11% |
|
5% | selenium | 917% |
|
59UG 107% | |
| 0.71MG 9% |
|
5% | zinc | 477% |
|
4.1MG 51% | |
| 70G | >999% | Water | 5% | 4.6G | |||
| 25G | 372% | Starch | 5% | 5.3G | |||
NO SIGNIFICANT AMOUNTS (either food): Alcohol, chlorine, chromium, fluoride, iodine, molybdenum, Vitamin D, Vitamin C, biotin (Vit B7), Vitamin B12, cholesterol, trans fat. |
|||||||
FAQ
Does brown rice or soy flour contain more calories in 100 grams?Both brown rice and soy flour are high in calories. Soy flour has 200% more calories than brown rice - brown rice has 123 calories in 100g and soy flour has 372 calories.
Is brown rice or soy flour better for protein?
Soy flour is a fantastic source of protein and it has 17 times more protein than brown rice - brown rice has 2.7g of protein per 100 grams and soy flour has 49.8g of protein.
Does brown rice or soy flour have more carbohydrates?
By weight, brown rice and soy flour contain similar amounts of carbs - brown rice has 25.6g of carbs for 100g and soy flour has 30.6g of carbohydrates.
Does brown rice or soy flour contain more calcium?
Soy flour is a rich source of calcium and it has 94 times more calcium than brown rice - brown rice has 3mg of calcium in 100 grams and soy flour has 285mg of calcium.
Does brown rice or soy flour contain more iron?
Soy flour is an abundant source of iron and it has 13 times more iron than brown rice - brown rice has 0.56mg of iron in 100 grams and soy flour has 8.2mg of iron.
Does brown rice or soy flour contain more potassium?
Soy flour is a rich source of potassium and it has 23 times more potassium than brown rice - brown rice has 86mg of potassium in 100 grams and soy flour has 2090mg of potassium.